Network
A self-healing Wirepas mesh extends sensor reach and means you need fewer gateways. Plan where the gateways go before you install, to avoid late data and fast battery drain.
You can see and diagnose the live mesh in the Networks application.
Planning the mesh before you go on site
The mesh establishes itself once the gateway and the sensors are activated, and it keeps re-arranging itself into the most efficient layout as conditions change. What it cannot do is invent coverage you did not plan for — so plan the layout first.
What you need before you can plan:
- the layout of the deployment area;
- where the Treon Industrial Node X sensors have to go;
- how each Treon Gateway will reach the internet (Ethernet, Wi-Fi or cellular), and where that is possible in the building;
- what data you will collect — KPIs only, or FFT and raw waveforms too.
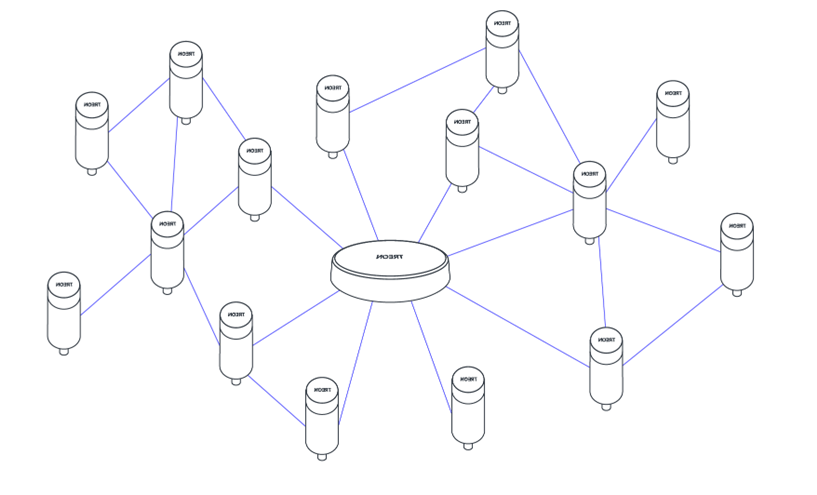
How the mesh behaves. Every node transmits its own measurements and relays for its neighbours. There is no fixed configuration: routes change as the network optimises itself, and with more than one gateway even the gateway a node reports through can change. If a device fails or a path is blocked, the mesh re-routes automatically. A gateway takes up to 14 nodes directly and several dozen more through the mesh.
Work outwards from the sensors. Their positions are fixed by the machines. From there decide where the gateways go, and only then whether you need routing nodes — nodes that take no measurements and exist purely to carry other nodes' data. Routing nodes need a specific configuration from Treon.
Place each gateway so that as many sensors as possible are in direct range. That keeps the nodes nearest the gateway from becoming congested with relayed data, and leaves the network room to optimise. The ideal layout is an actual mesh, not a tree.
Adding devices later
Add nodes or gateways afterwards and the whole mesh re-organises itself. That takes a few hours, during which the nodes keep working normally.
How many gateways
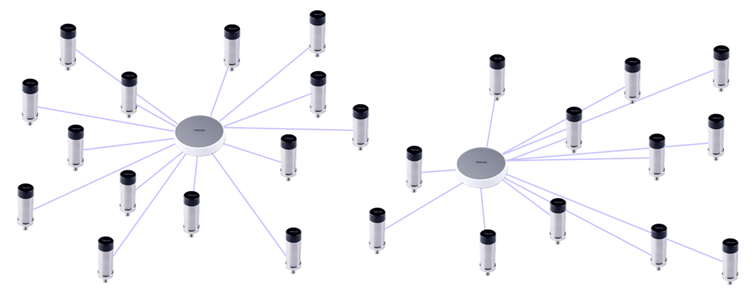
A gateway connects up to 14 nodes directly and tens more through the mesh. Deploy a second gateway at the latest when more than 50 nodes are connected.
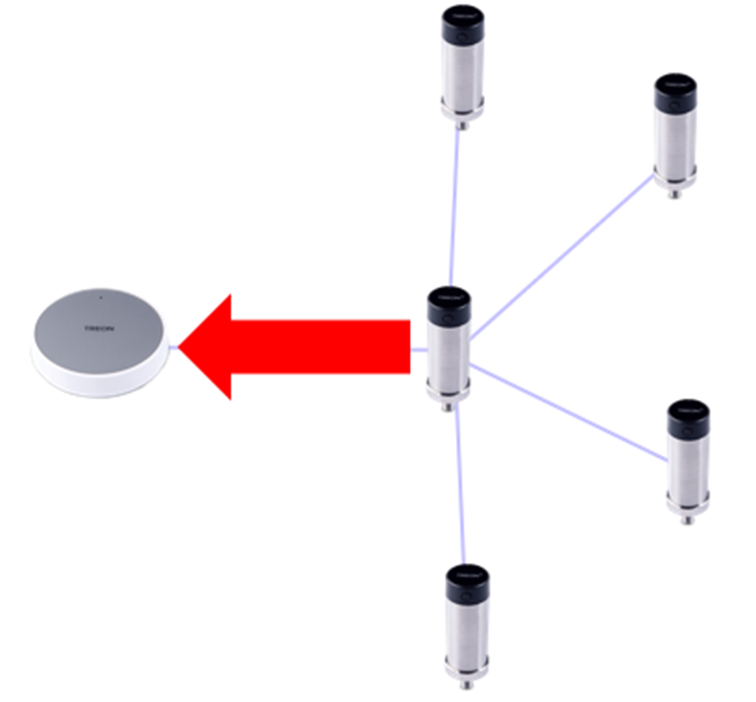
The number is not the only trigger. Watch for layouts that would create "super-routing" nodes — a handful of nodes carrying everyone else's traffic:
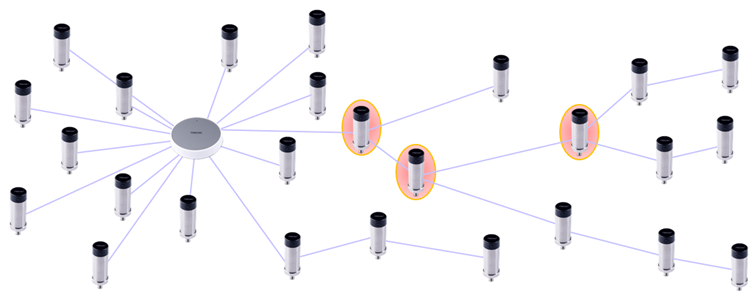
Congested traffic means data that arrives late or not at all, and those relaying nodes also flatten their batteries first. Adding a gateway is usually a better answer than adding relays:
Keep routes short
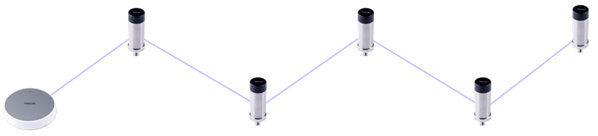
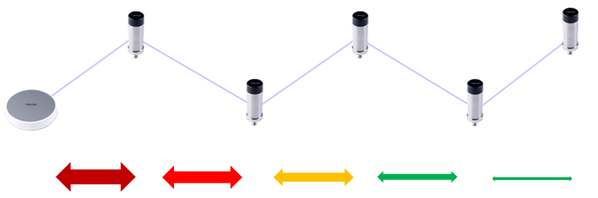
Each node's data should reach a gateway by the shortest path available. A long chain concentrates traffic — and battery drain — on whichever node sits nearest the gateway:
Bridging gaps and obstacles
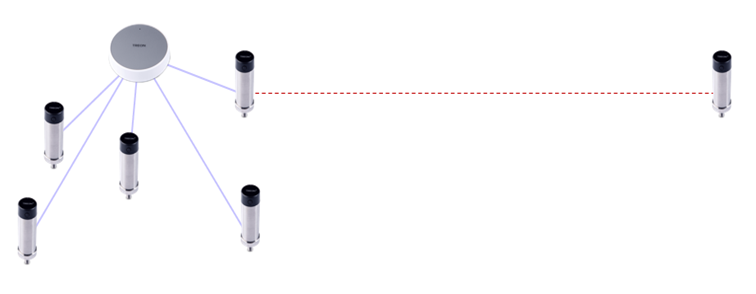
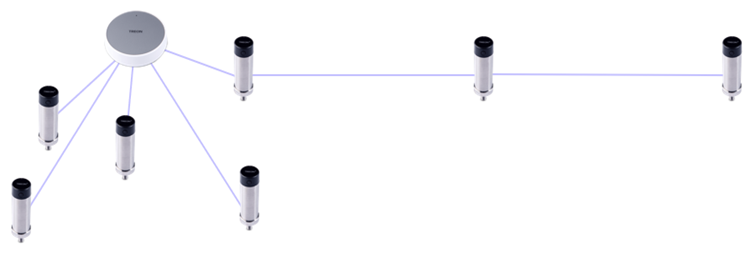
Where a sensor is simply too far from anything to join, a routing node placed between them closes the gap:
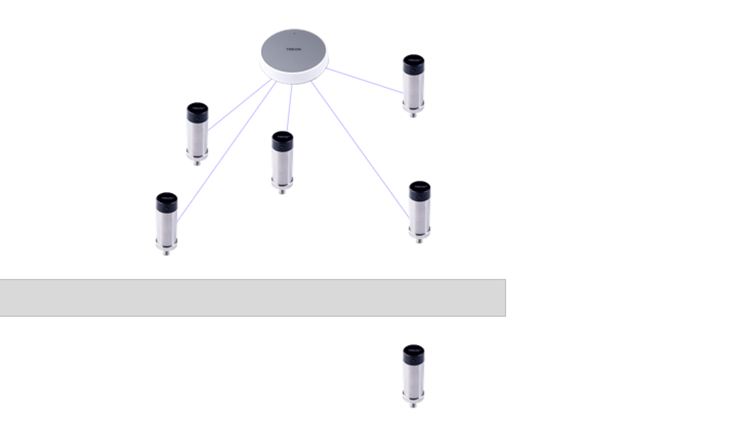
The same trick gets you past structure. Thick walls and large metal objects block the signal, and a node positioned to see both sides reconnects whatever is behind the obstacle:
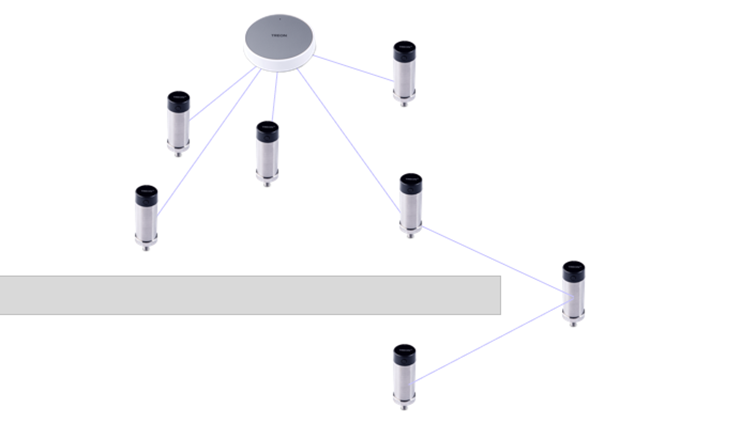
Aim for each sensor to be within reach of several neighbours rather than exactly one. And avoid bridging a long distance with a single chain of routing nodes when an extra gateway near the sensors would do instead.
You will not always know in advance that a gap exists. Depending on the three-dimensional layout and on what the structures are made of, a signal can bounce further than expected or die closer than anticipated — often only the on-site install reveals it. Go on site prepared to add gateways and routing nodes.
What limits the mesh
Distance and obstacles
In a good setting, node-to-node and node-to-gateway distances of 10–60 m are realistic. In an industrial environment, walls, large machines and other reflecting or obstructing structures are the norm, and radio behaviour is hard to predict: a distant node can be unexpectedly strong because a surface reflects just right, and a nearby node weak because a small obstacle sits in the wrong place.
Identify the nodes with weak signal and look at the three-dimensional space around them. Obstacles can sometimes be moved; more often an extra node bridges the gap. Where the layout has clusters of nodes, or a few distant ones, an additional gateway close to them is the better answer.
Account for how the space is used when fully operational — people, moving goods, forklift traffic and animals all affect radio signals.
Signal strength (RSSI)
| RSSI | What to expect |
|---|---|
| ≥ −60 dBm | Excellent. |
| −75 to −60 dBm | Good. Aim for this or better for stability. |
| −80 to −75 dBm | Average. KPIs work fine; FFT and raw data may have issues on larger networks. |
| −85 to −80 dBm | Bad, unstable. KPIs work; FFT and raw data are likely to drop packets. |
| ≤ −85 dBm | No connection. |
Signal strength only limits throughput once link quality is poor — but when it is poor, burst data suffers long before KPIs do.
Routing alternatives, and routing chains
The best layout is literally a mesh: every node connected to several others, and as many nodes as possible connected straight to a gateway, so data has alternative paths.
The worst layout is one long routing chain. Every node in the chain carries the data of every node behind it, so the node nearest the gateway carries the most. That produces late and lost packets when its buffer peaks — and it drains that node's battery fastest. If you can see a routing chain on the network map, break it up with additional nodes or a gateway placed beside it.
Large data in the mesh
Scalar and burst data are not remotely the same load. With standard product settings:
| Data type | Messages per measurement |
|---|---|
| KPI (scalar) | ≈ 6 — three axes × two values |
| FFT (burst) | ≈ 600 |
| Raw waveform (burst) | ≈ 1 666 |
Burst data is split into fragments by the sensor and reassembled in the cloud, so a single waveform measurement is nearly three hundred times the message count of a KPI measurement. If you intend to use FFT or waveform data, the mesh has to be planned for it.
The rough formulas:
- KPI = axes × number of calculation IDs
- FFT = axes × FFT lines × calculation IDs ÷ 48
- Raw = axes × sample count ÷ 48
Buffers
Each Treon Industrial Node X has two buffers.
The measurement buffer holds the node's own measurements until they are forwarded — space for 110 592 individual measurements. Once it is full the node stops taking new measurements until the data has been transmitted: on-demand measurements are refused with a "sensor occupied" message, and timed measurements are postponed and then resume on their normal schedule.
Example
A node measures every hour on the hour. An on-demand measurement at 10:55 takes 10 minutes to transmit, so the hourly measurement runs at about 11:05 instead of 11:00. The next one is back on schedule at 12:00.
The routing buffer is much smaller, and its effective size depends on what else the mesh is doing. Data passing through sits there until it can be forwarded — usually immediately. A node that has its own data to send and is relaying for others does both at once, so everything takes longer; a node relaying raw data for several others can congest. Congestion affects the whole branch behind it, and costs individual fragments or entire measurements.
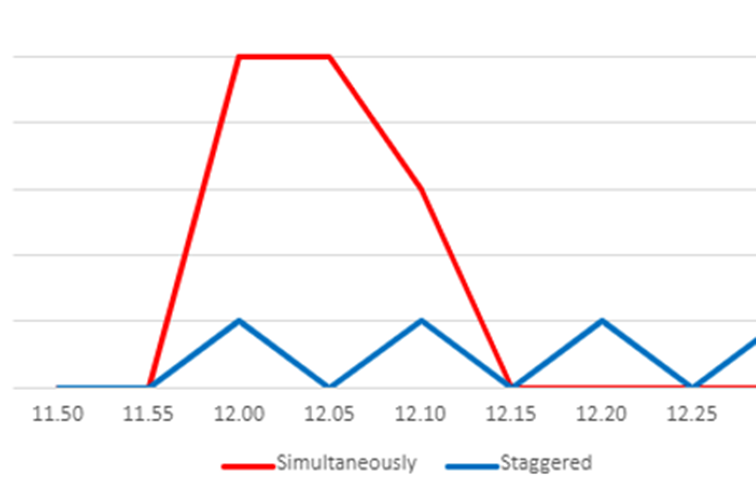
Stagger the triggers
The more data crosses the mesh at once, the more likely a buffer overflows. Triggering sensors at staggered times spreads the load and is often the cheapest fix available.
Verifying the mesh
Test the network twice: a dry run off site before deployment, and a performance check on site afterwards, including a stress test that triggers every node at once. Both are covered in Connectivity verification.
Battery consumption is affected by routing as well as by measuring — a node relaying long chains pays for it. Use the network map to find long paths, and add gateways where devices depend on too many hops. See Configuration.
Symptoms and what they mean
No data at all, though every node is activated and the gateway is online and connected. Check each node's status light is green — green means connected to a sink in a gateway.
A node's status light is not green. No light at all means it is not powered on, or the battery is exhausted. Red means it has no connection to another node or the gateway. Check the other nodes: if several are red, look for a break in the chain, and confirm nodes are within range of each other with no major obstruction between them.
Only part of the data from one or more nodes arrives. Messages arriving sporadically were buffered and sent late. This shows up with FFT and raw data on nodes that also forward several other nodes' measurements — the buffer overloads and data is lost. Add alternative routes, or gateways in other areas, to keep transmission paths short.
One or more individual nodes never deliver data, though the deployment works otherwise. Check those nodes are activated and connected, that their messages reach the gateway, and that the backend connection is set up correctly.