Reading spectra and waveforms
KPIs tell you that something is changing. Spectra and waveforms help you work out what. You view them on a measurement point in Condition.
Available on Treon Make (Treon Industrial Node X)
Spectra and waveforms are captured by the Treon Industrial Node X sensor used in the Treon Make solution. Treon Flow machines (Treon Industrial Node C) are KPI-only and have no spectra or waveforms to open — see Overview of solutions.
Waveform — the time domain
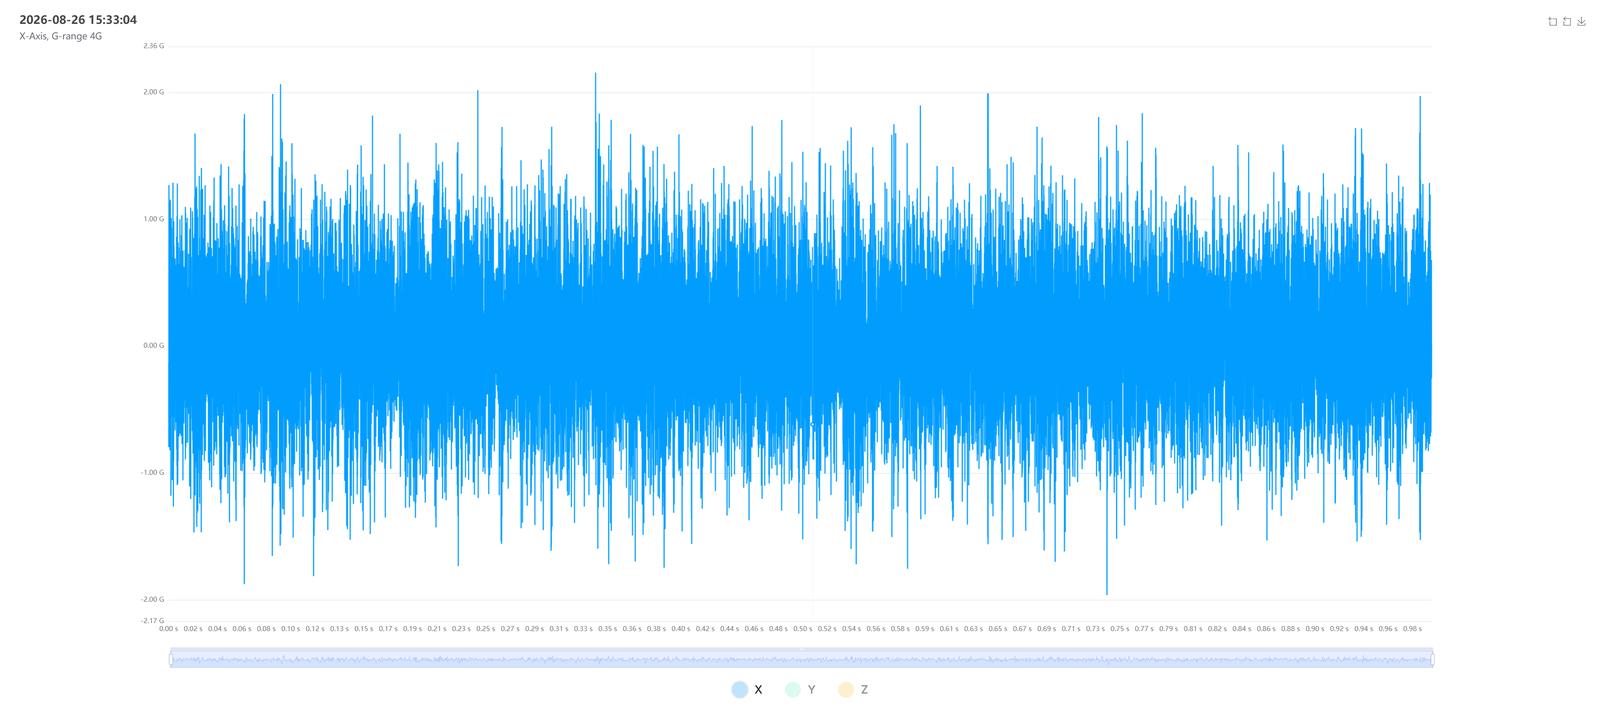
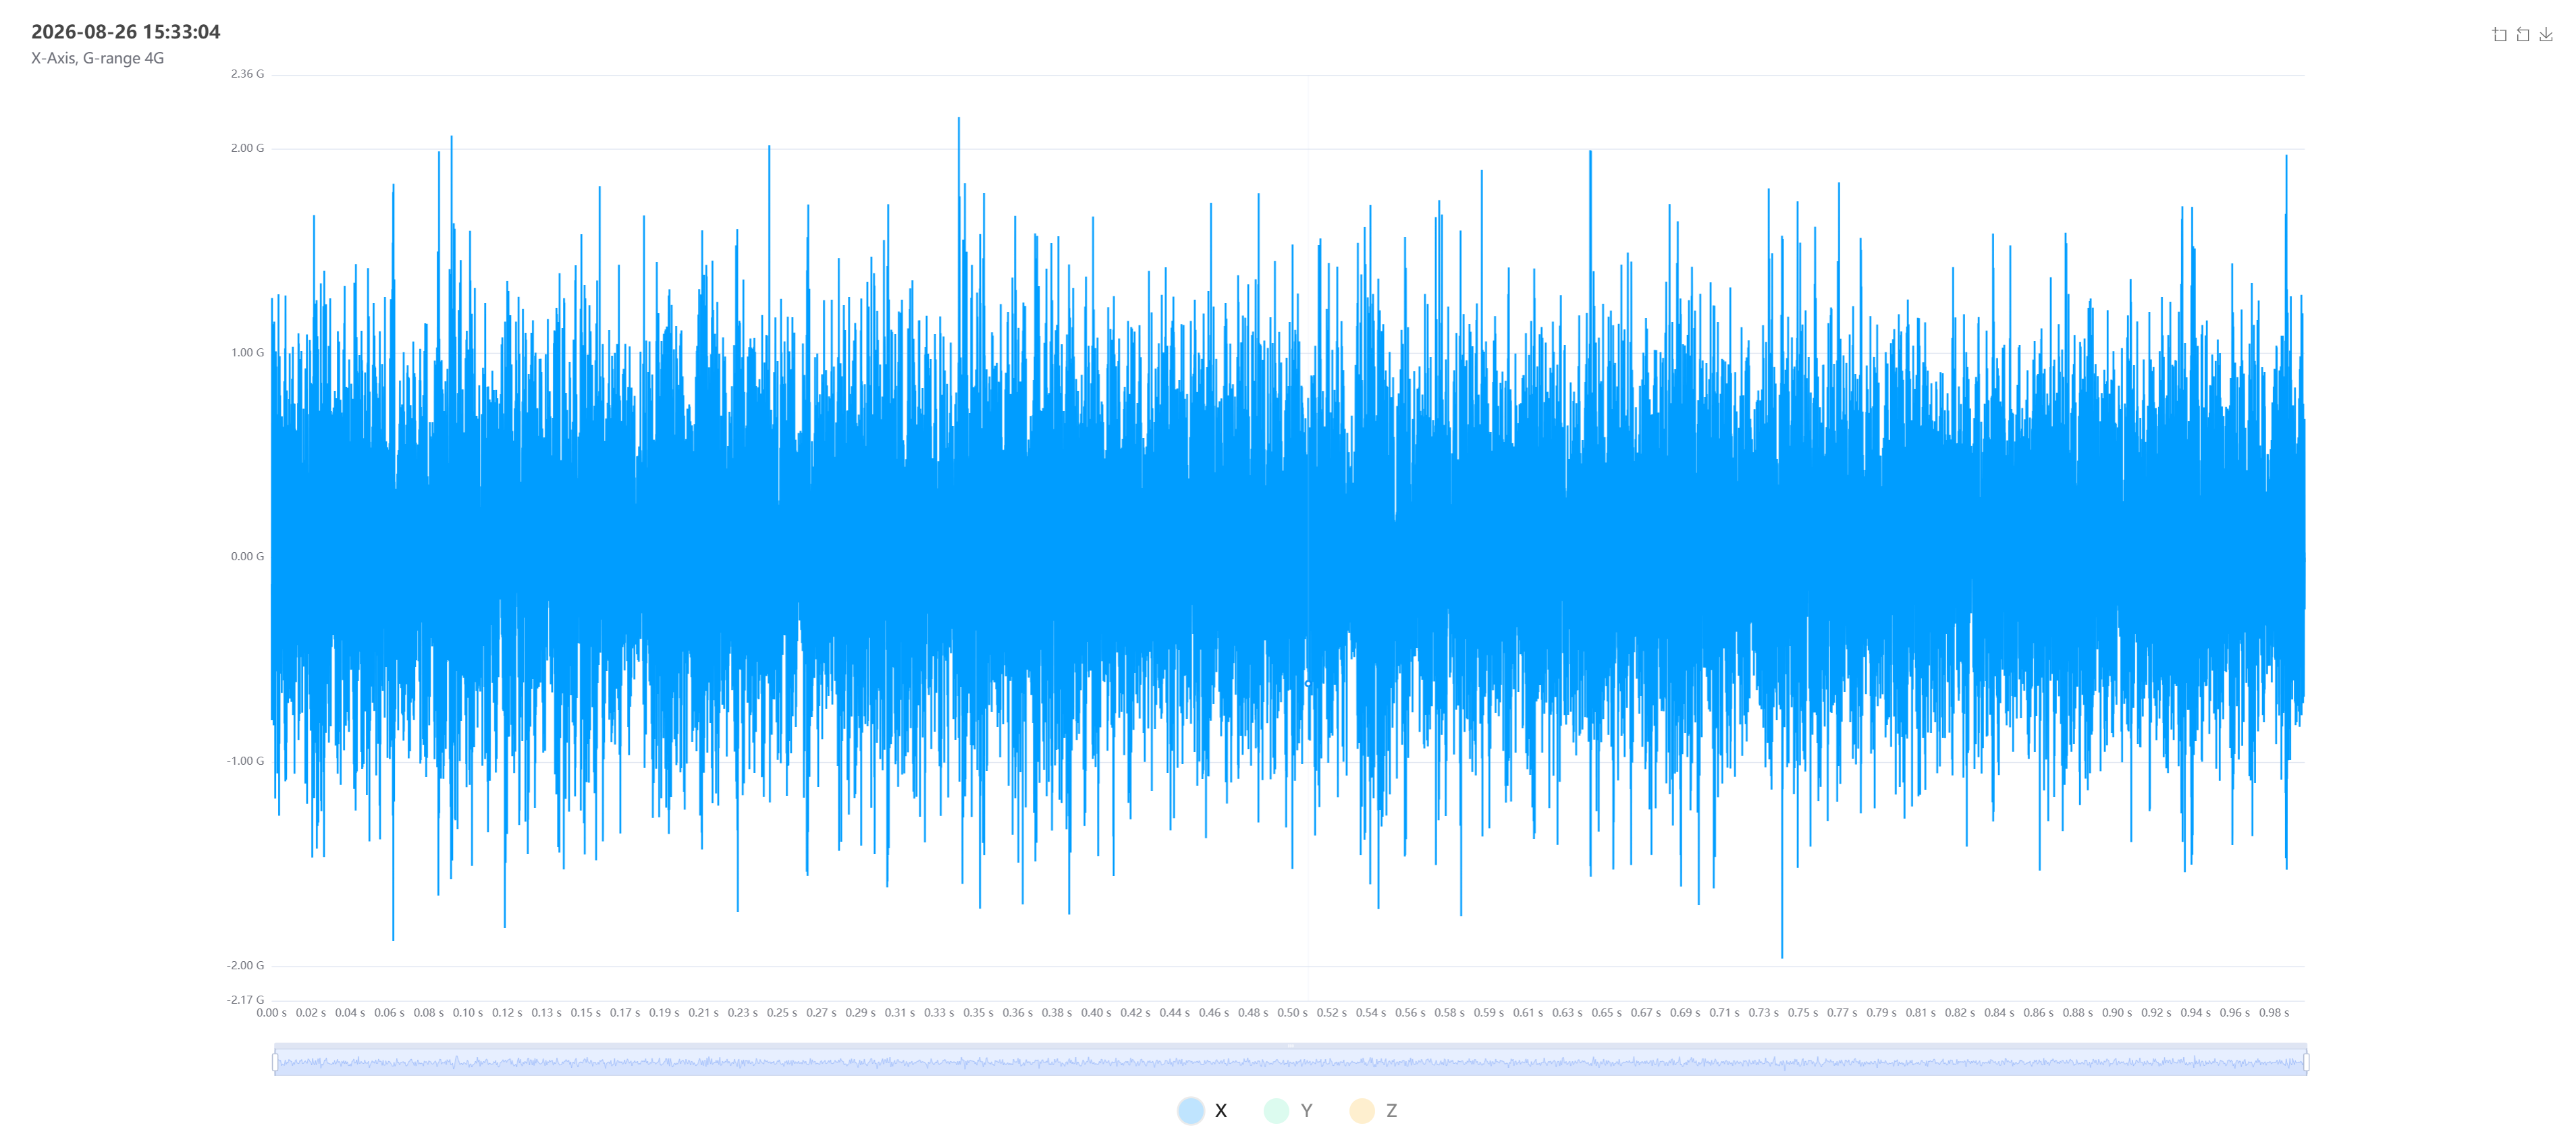
A waveform is the raw vibration signal over a short slice of time: amplitude on the vertical axis, time on the horizontal. It shows the signal as it actually happened — useful for seeing impacts, modulation, and the overall character of the vibration. Waveforms are captured per axis (X, Y, Z).
Spectrum — the frequency domain
A spectrum (FFT) breaks the same signal into the frequencies it contains: amplitude on the vertical axis, frequency on the horizontal. This is the core diagnostic tool, because different faults show up at characteristic frequencies tied to the machine's running speed and geometry:
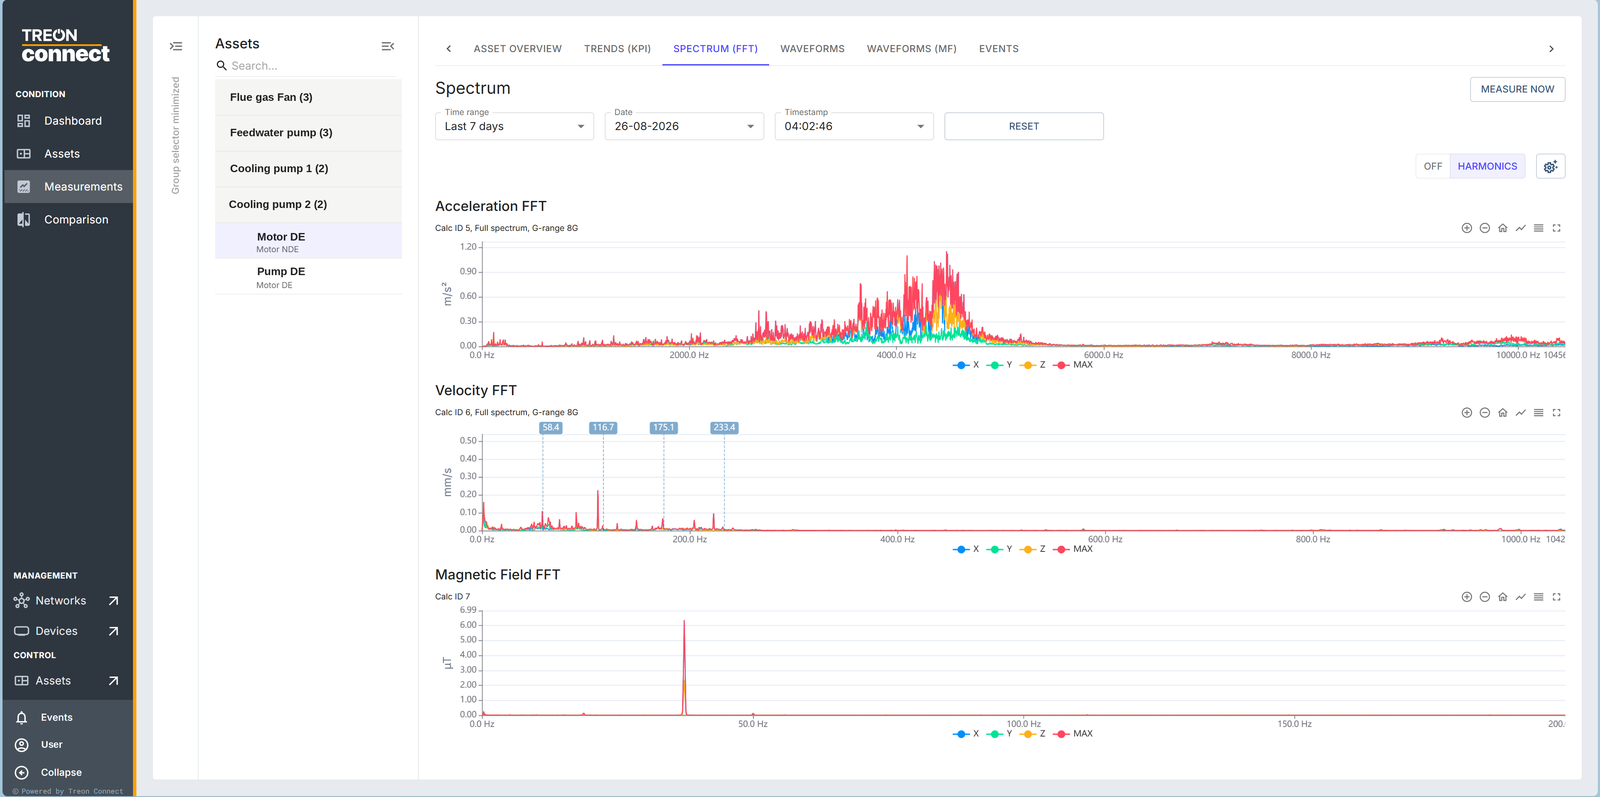
You open it on the measurement point's Spectrum (FFT) tab, choosing the measurement by date and timestamp. On a healthy point the spectrum stays low and flat, as above; a developing fault raises peaks at the frequencies below.
- Imbalance — a peak at 1× the running speed.
- Misalignment — often 1× and 2× running speed, sometimes axial.
- Looseness — multiple harmonics of running speed.
- Bearing defects — peaks at the bearing's specific defect frequencies, usually high-frequency and often accompanied by rising kurtosis before they dominate the spectrum.
- Gear problems — peaks at gear-mesh frequency and its sidebands.
Reading which frequencies grew, relative to the machine's running speed, points to the mechanism — which is why a spectrum turns "velocity RMS is rising" into "the coupling is misaligned."
Magnetic field — for electric motors
Treon Industrial Node X also captures a magnetic field signal. On electric motors this adds a diagnostic dimension that vibration alone can miss: electrical faults (broken rotor bars, winding or supply problems) leave a signature in the magnetic field. It is read the same way as a waveform — as a signal you compare against a healthy reference.
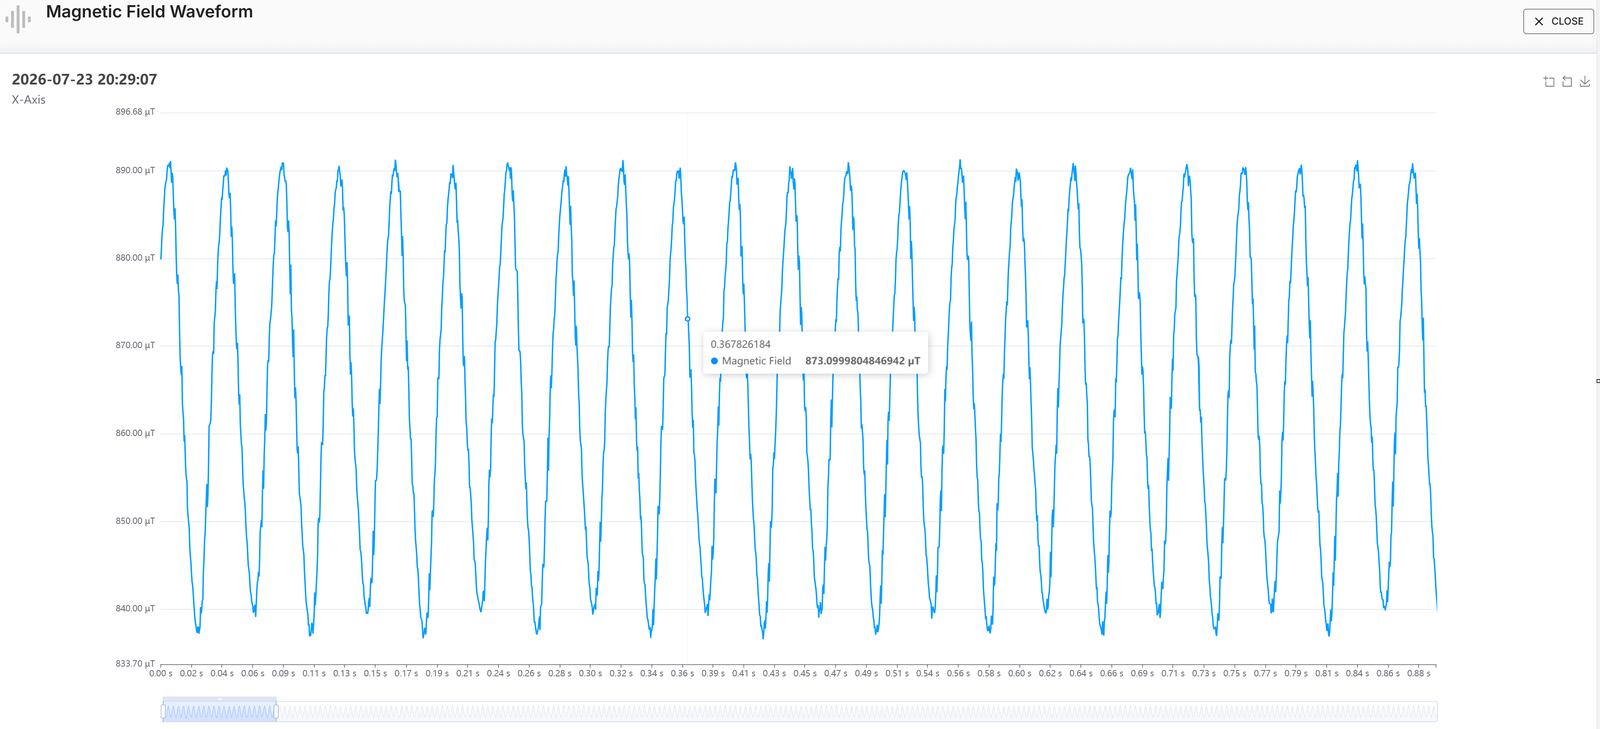
The trace above is a healthy motor: a clean, regular cycle at a steady amplitude. Distortion of that shape, or sidebands around it in the corresponding spectrum, is what points at an electrical fault. Magnetic field is also what the platform derives RPM from, given a pole-pair count — so it is what lets spectrum peaks be read against the real running speed.
Using them together
Start from the KPI trend that flagged the machine, then open the spectrum to localise the fault frequency, and the waveform to confirm its character (steady vs impulsive). Comparison lets you line the same view up against a healthy period or a sister machine.