Networks
Manage connectivity centrally and keep data flowing. Networks shows a live map of gateways, sensors and routes across Wirepas mesh, Bluetooth, cellular, Ethernet and Wi-Fi.
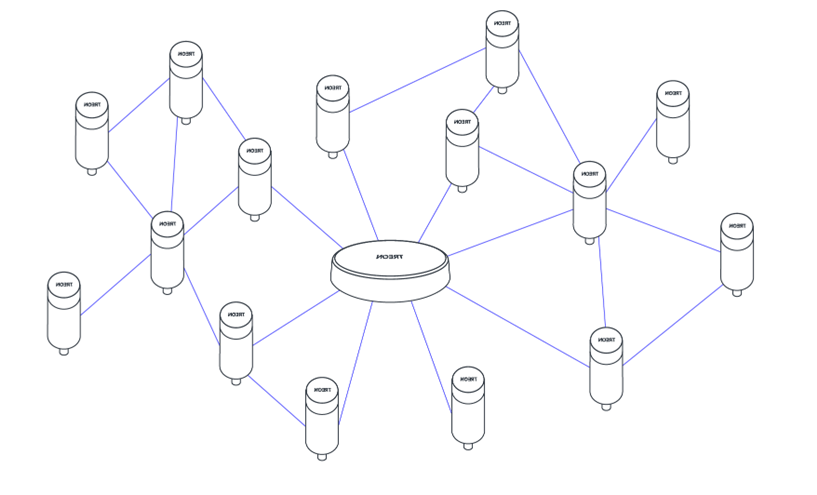
Treon Industrial Node X sensors relay data to a gateway over a self-forming Wirepas mesh — each node can hop through its neighbours to reach the gateway, extending range and adding redundancy:
Reading the map
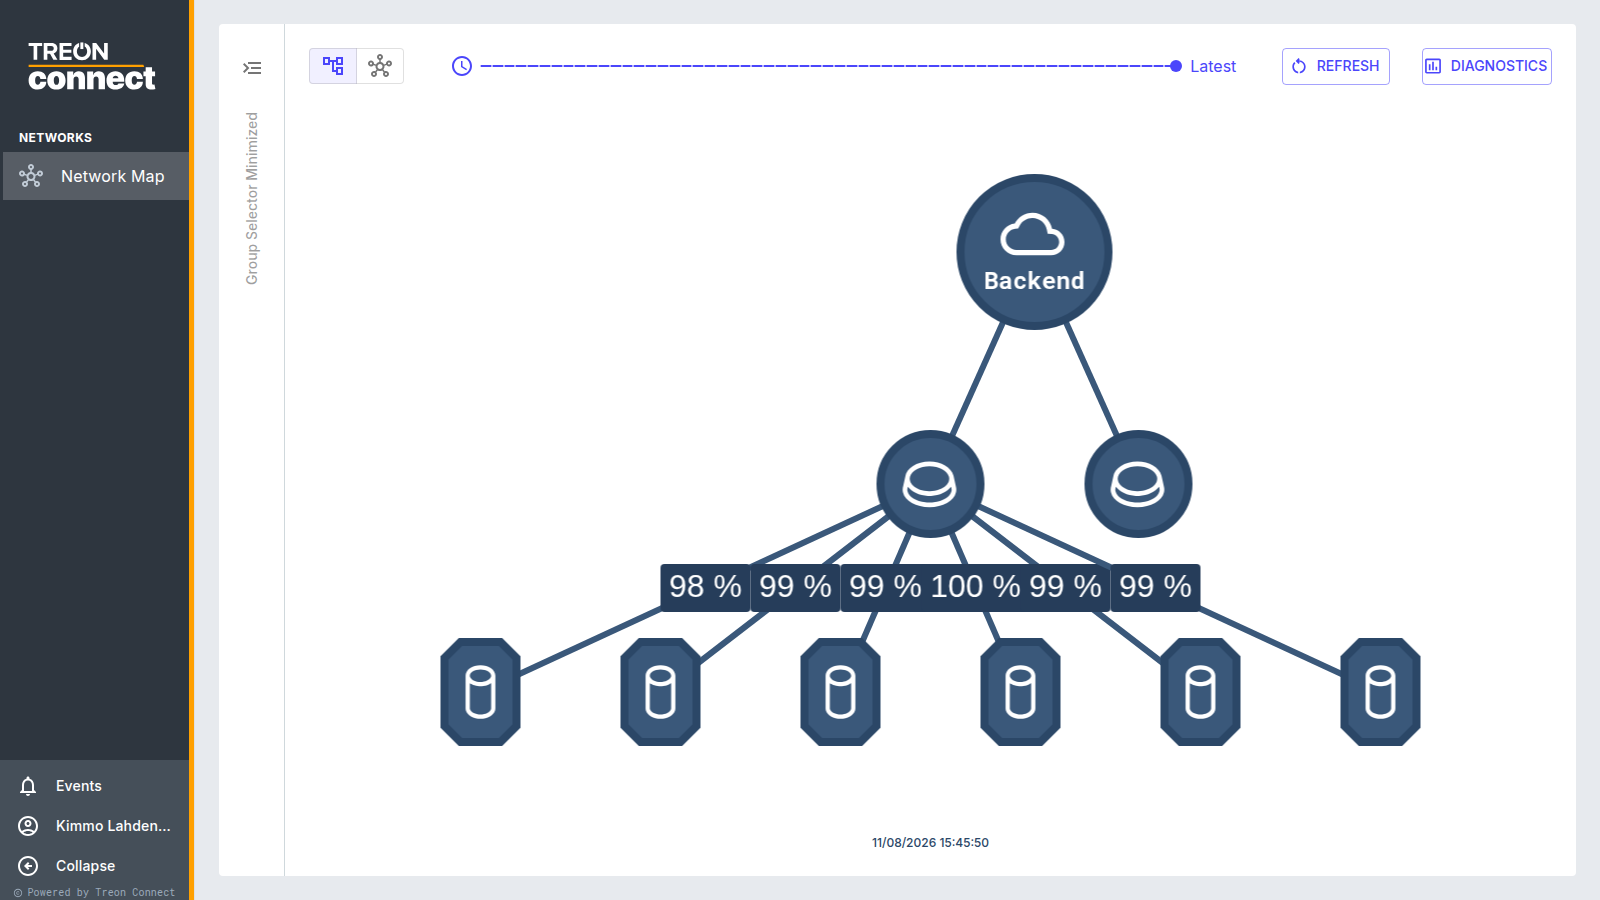
- Nodes are drawn by tier — the cloud backend, the gateways, and the sensors beneath them.
- Edges run from each device to its parent — the route its data takes. An edge is labelled with its connection quality (a percentage, or Poor / Good / Excellent); hover an edge for its connection method.
- Hover a node for its details: name, online/offline, connection method, installation quality, serial and model, last communication, next-hop RSSI (dBm) and quality, and its network addresses. Hover an edge for its connection method.
- Layout — toggle between a tree layout and a hub / star layout.
- History — the time slider steps back through past snapshots (up to about 30 days); Latest is the live view. While you drag the slider the graph greys to show you're scrubbing history; the snapshot you land on renders normally.
- Group filter — the group selector greys out devices outside your selection.
- Refresh re-fetches the topology; the timestamp shows when it was last updated.
A sensor isn't on the map
A node missing from the map usually hasn't joined the network, or hasn't reported since the last refresh. Check it's powered and in range of a gateway or a neighbouring node, confirm the group filter isn't hiding it, and use the history slider to see when it last appeared, then Refresh. Persistent absence after commissioning is worth a support ticket with the node serial.
Diagnostics
For per-device signal and network-health trends, open Diagnostics.