Analyze data
The daily loop starts at the dashboard and ends at a mechanism: not "velocity RMS is rising" but "this bearing is failing". This guide is the path down through the data.
You can do all of it from the web applications at a desk, or from the mobile app at the machine — both show the same data and the same events.
1. Start at the dashboard
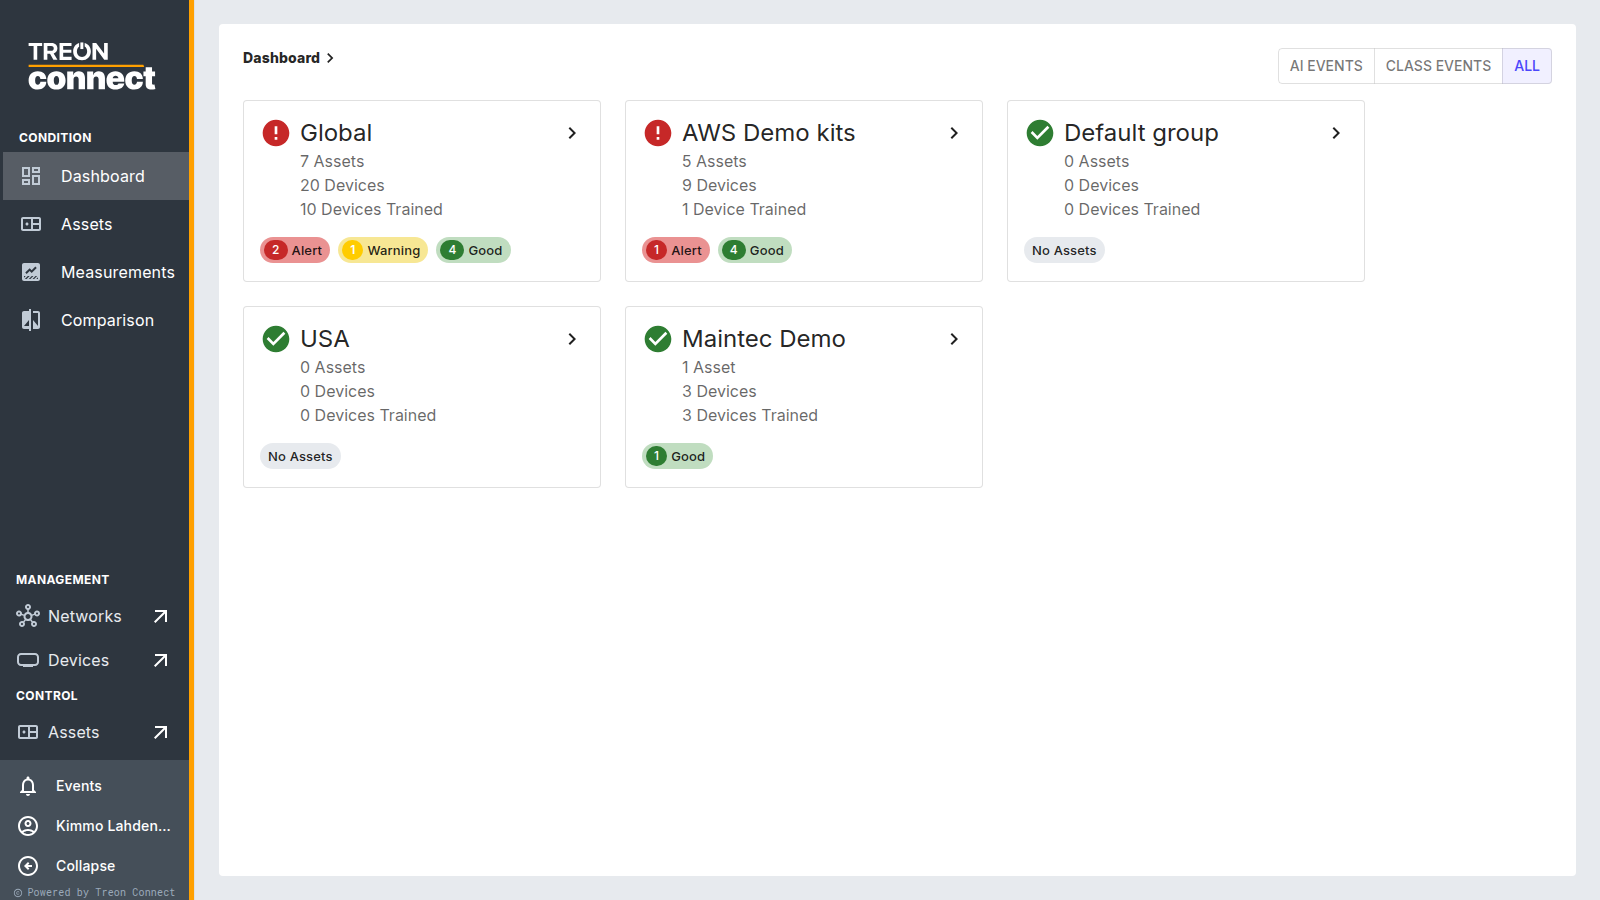
Open Condition. Each group card breaks down into Alert / Warning / Good, so go where the red is: click a group to see its assets, then an asset to reach its measurement points.
2. Read the KPI trend
On a measurement point, the Trends (KPI) tab plots the KPIs over time — velocity RMS, acceleration RMS, temperature and, on a Treon Industrial Node X, magnetic field. ISO limits from the assigned class are drawn on the velocity trend, so you can see the margin at a glance.
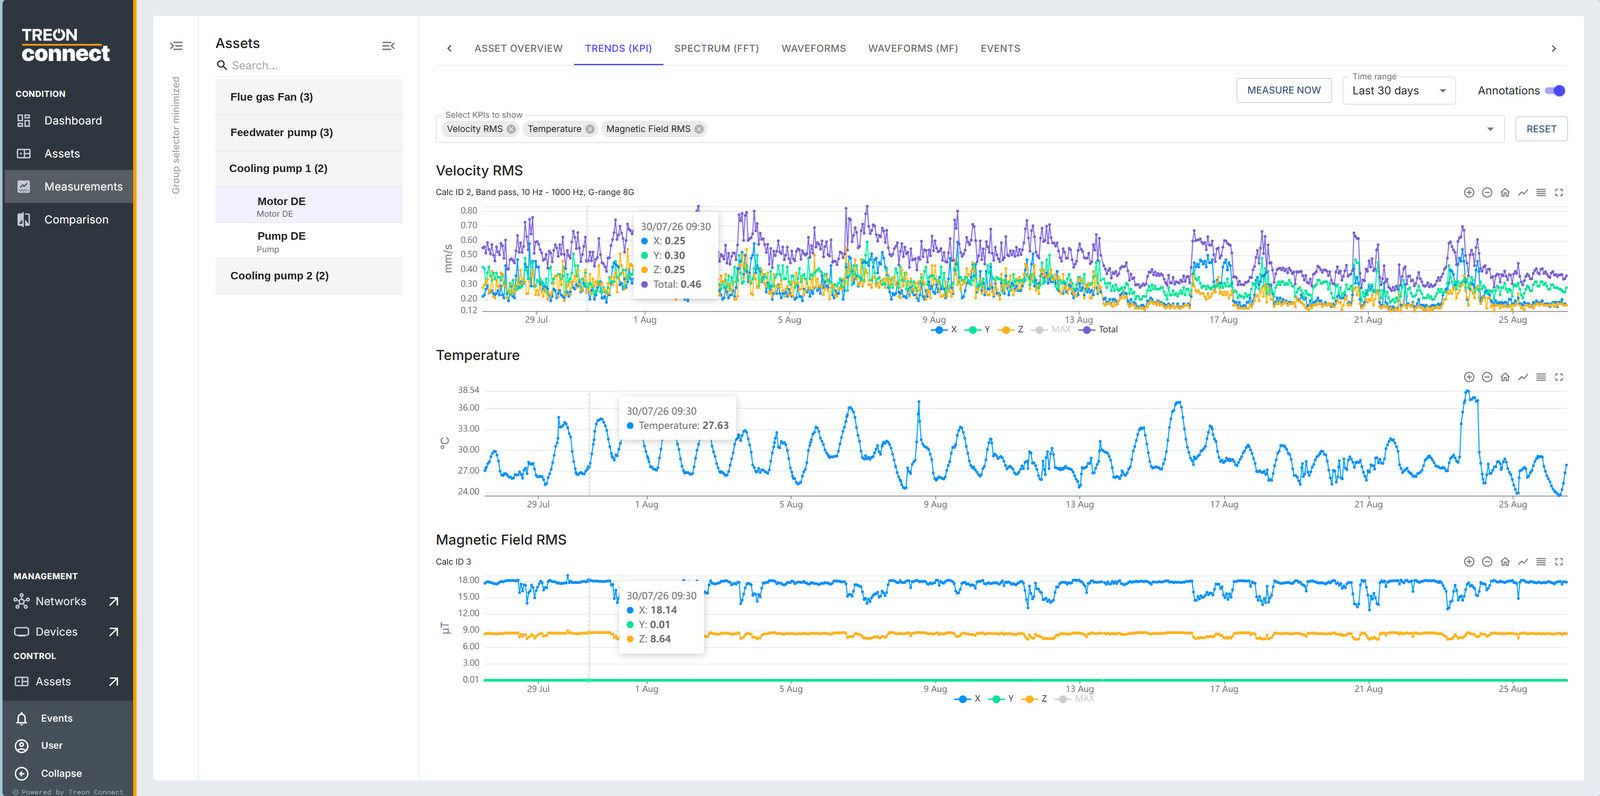
What you are looking for is shape, not a single value:
- a step — something changed at a moment (a repair, a load change, a new fault);
- a ramp — something is developing;
- a spike — often a one-off event rather than a machine problem;
- a flat line at zero — the machine is off, not healthy.
See The KPIs explained for what each KPI is sensitive to.
3. Go to the spectrum
On a Treon Industrial Node X machine, the Spectrum (FFT) tab is where the diagnosis happens. The KPI tells you something changed; the spectrum tells you what — the frequency of the peak identifies the mechanism.
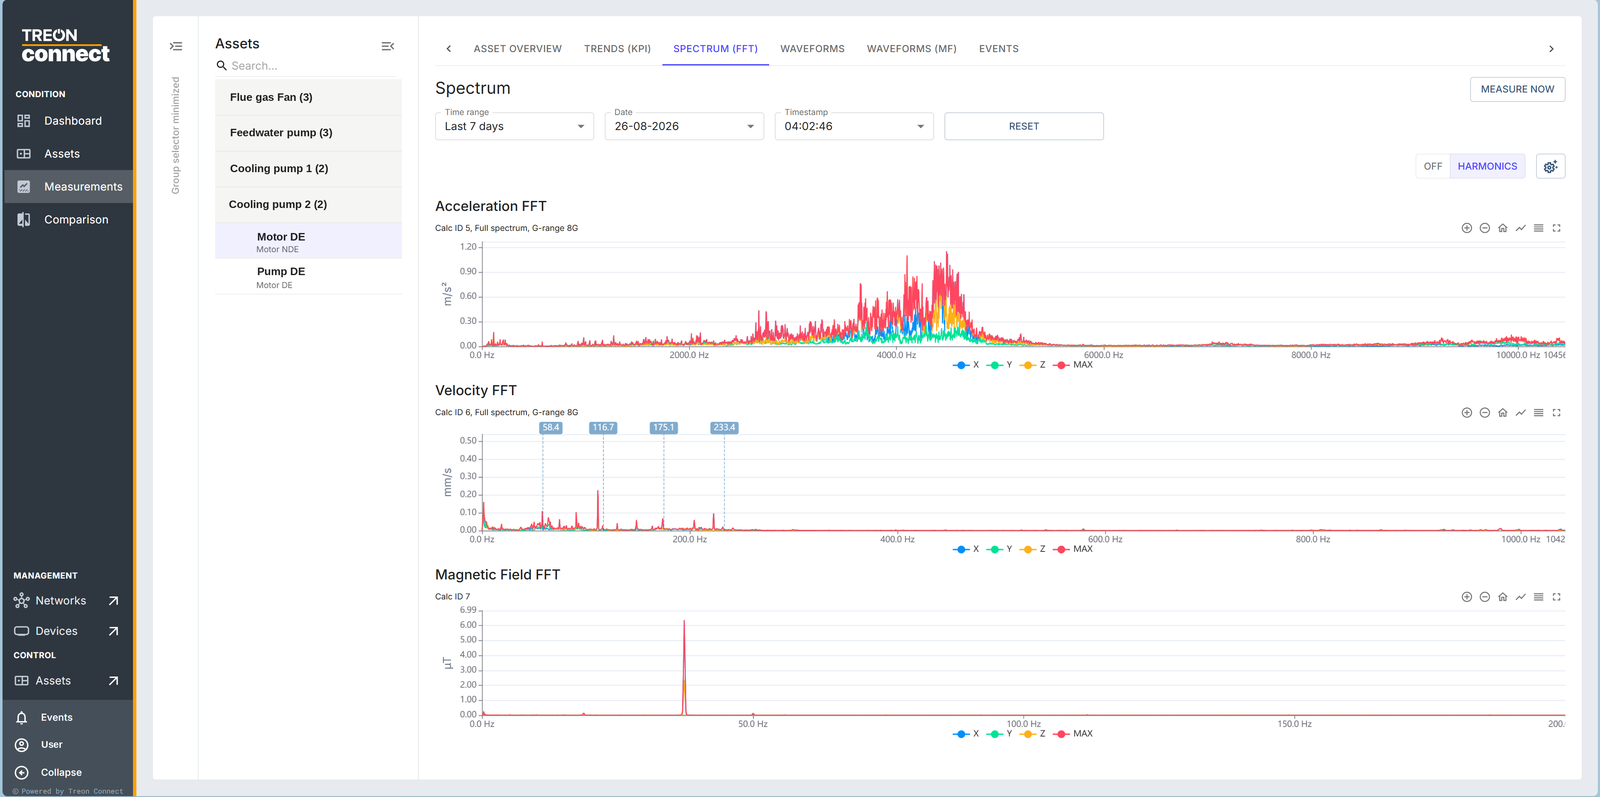
Use the Harmonics cursor to check whether peaks are multiples of the running speed. See Spectra & waveforms explained.
Treon Flow machines are KPI-only
A Treon Industrial Node C does not capture spectra or waveforms. On those machines the trend, the ISO limits and AI anomaly detection are the analysis.
4. Check the waveform for impacts
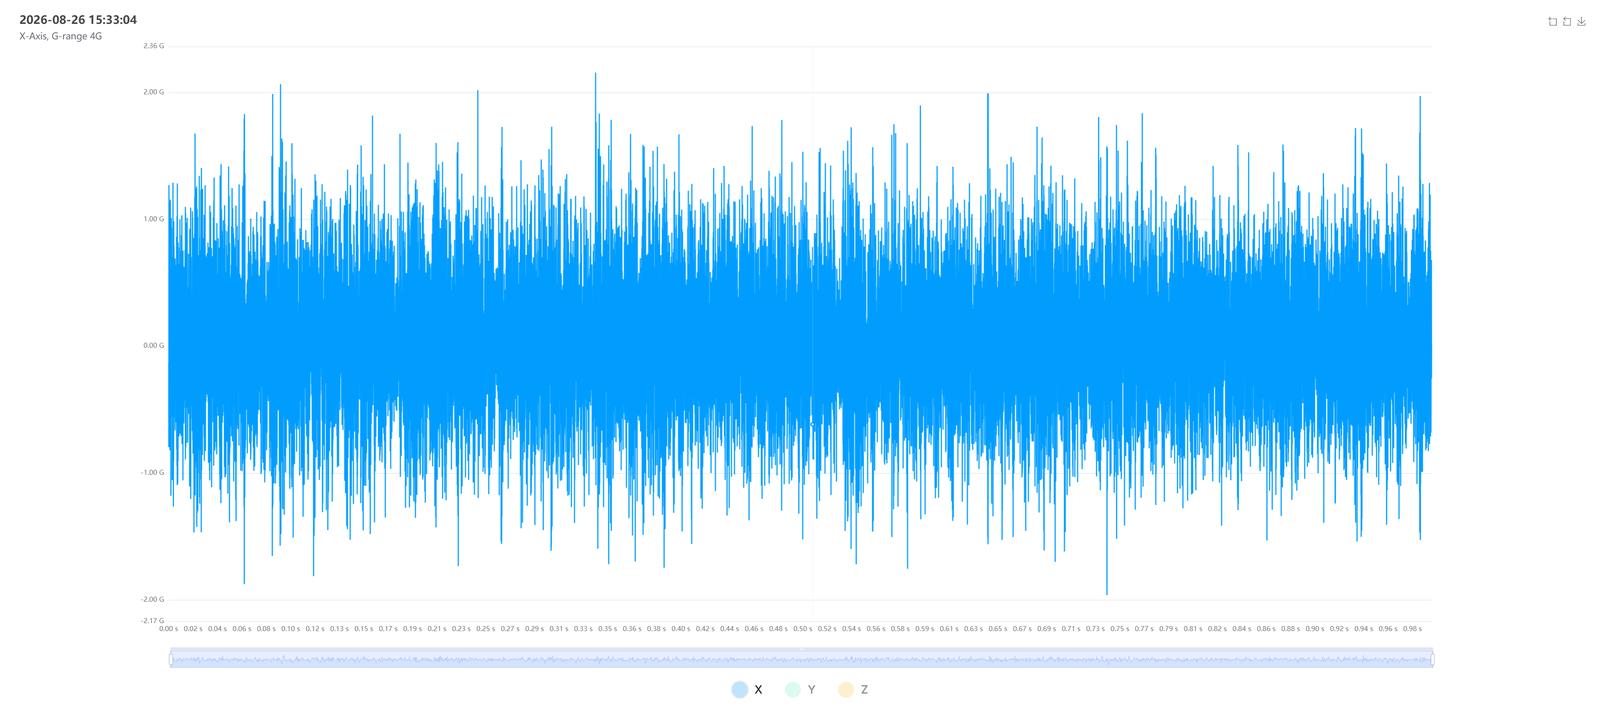
The Waveforms tab shows the raw signal in the time domain — the place to spot impacts, looseness and rubs that the averaged spectrum smooths away.
5. Compare against peers and against the past
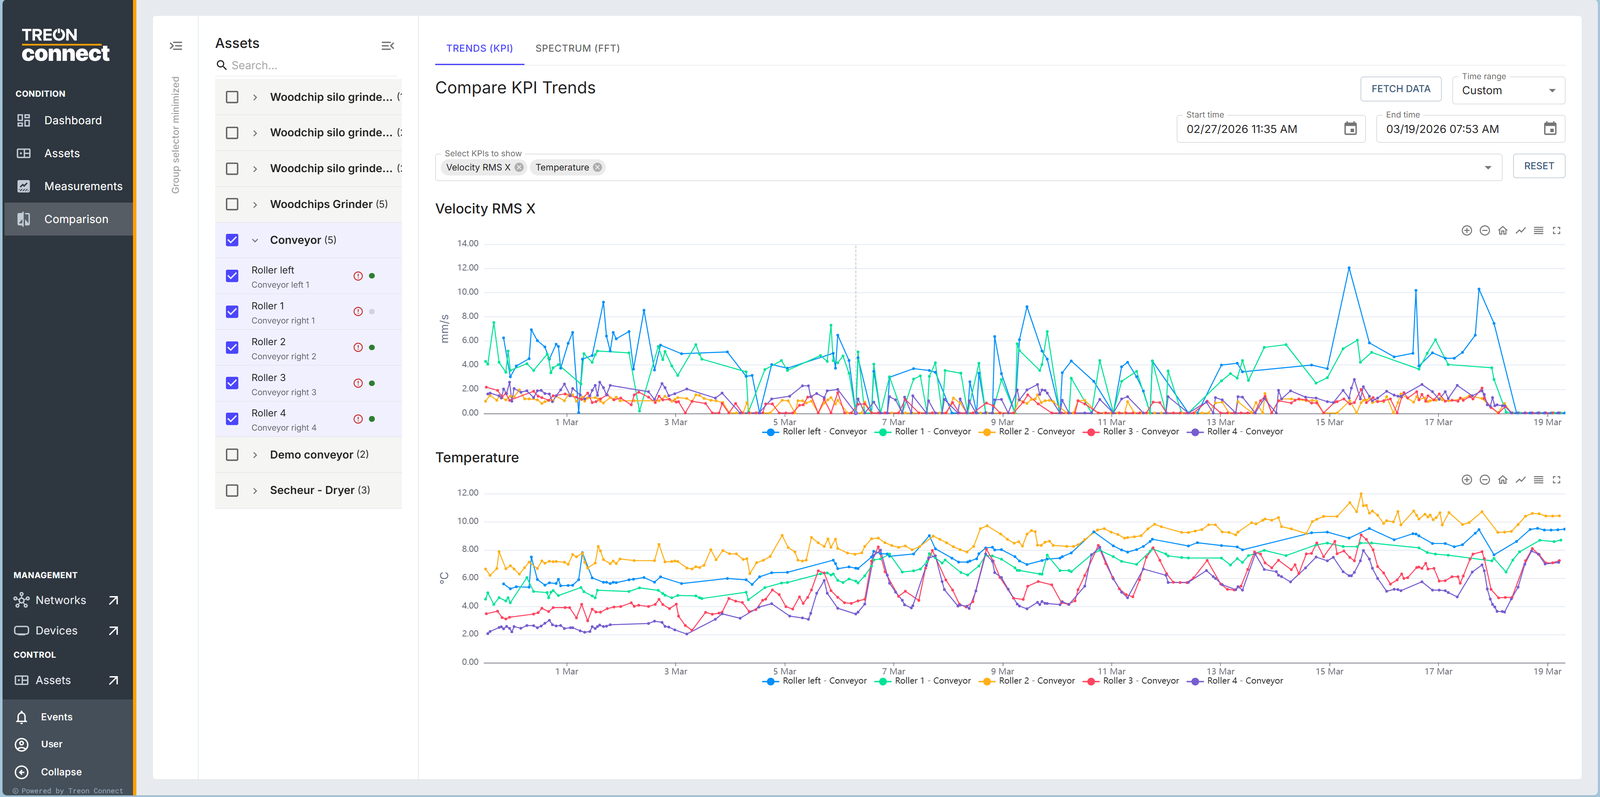
Use Comparison to put a machine next to its own history or next to identical machines. Two nominally identical pumps side by side answer "is this normal for this machine type?" faster than any single trend.
6. Measure now if you need fresh data
Measure Now triggers an immediate measurement instead of waiting for the next scheduled one — useful when you are standing at the machine, or when you have just changed something.
Battery sensors are asleep between measurements, so the result takes a few minutes; FFT and waveform data can take up to about 10 minutes to arrive.
Next: Handle events.