Create reports
Notifications tell people about single events. Reports give a regular picture of a whole group of machines to people who are not in the application day to day.
1. Decide what the report is for
Report criteria come from a question. Common ones:
| Question | Report |
|---|---|
| "How are the machines on this line doing?" | KPI summary for the group, weekly |
| "What has been flagged since last month?" | Event overview for the group, monthly |
| "What does this machine's spectrum look like now?" | FFT plots for one asset, on demand |
2. Build it
In Reports, create a report and work through the three steps:
- Report Criteria — the groups, assets and measurement points, the KPIs, and the period.
- Frequency & Recipients — how often it is generated and who it is emailed to. Recipients do not need to be Treon Connect users.
- Preview & Save — check the output before you commit to sending it to anyone.
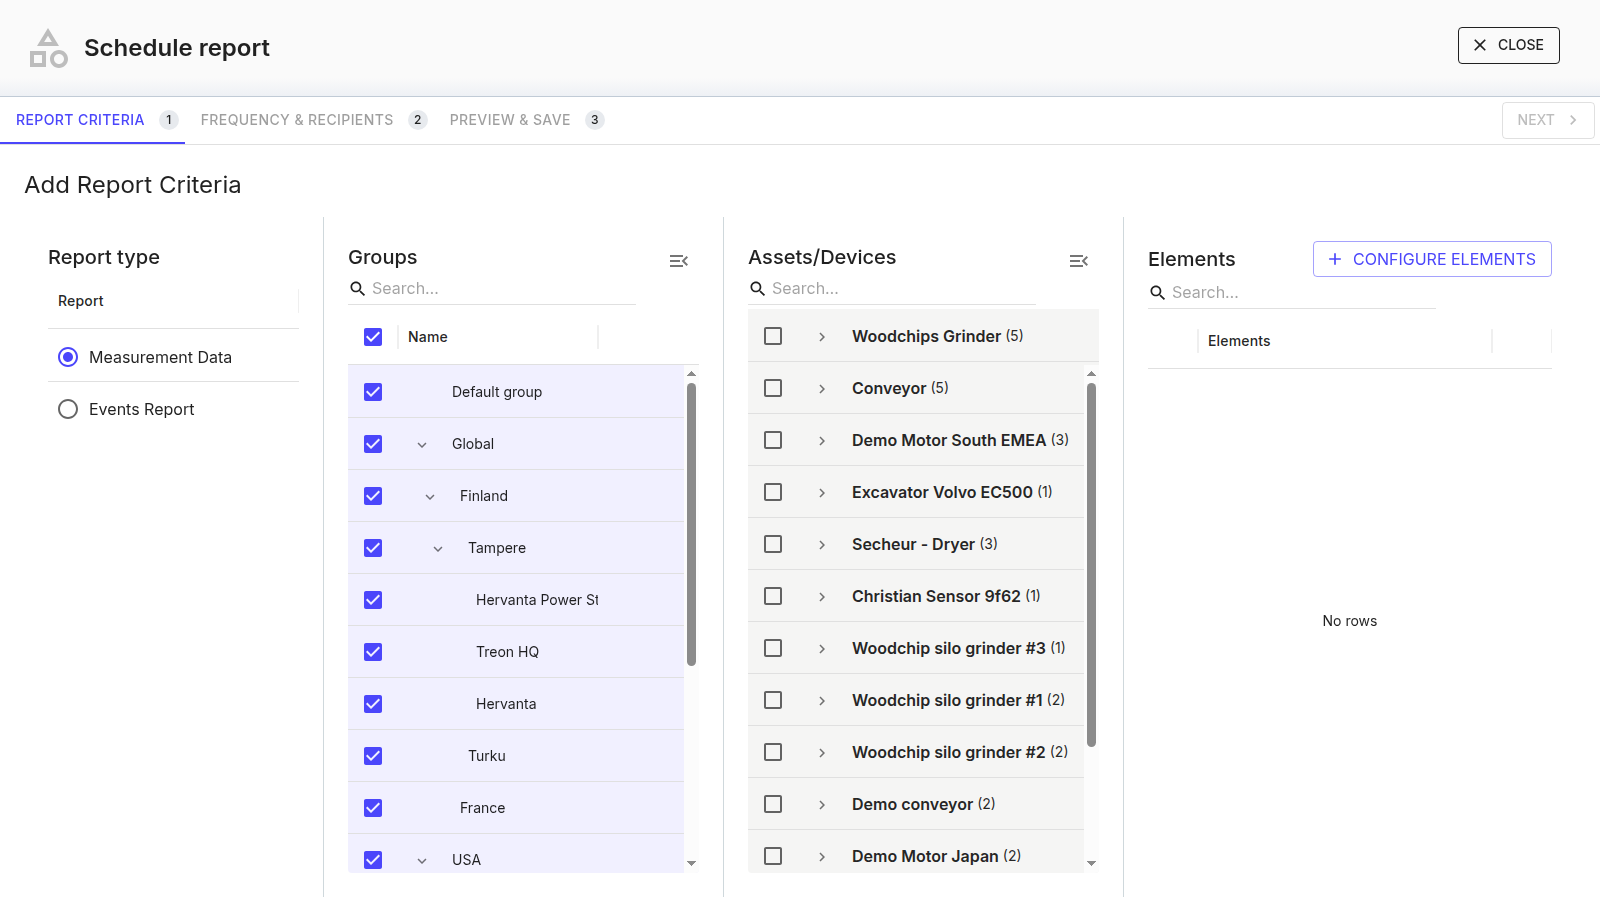
See Creating a report for the field-by-field detail.
3. Check the first one
Generate the report once and read it before it goes out on a schedule. A KPI showing "No Data" usually means the KPI is not enabled on that sensor's measurement profile, not that the machine is silent — see a report shows "No Data" for a KPI.
4. Keep the set small
Reports are read when they are few and expected. One weekly summary per line and one monthly roll-up is usually plenty; past that they stop being opened.
Past reports stay available in the report list to view, download or delete.