Network diagnostics
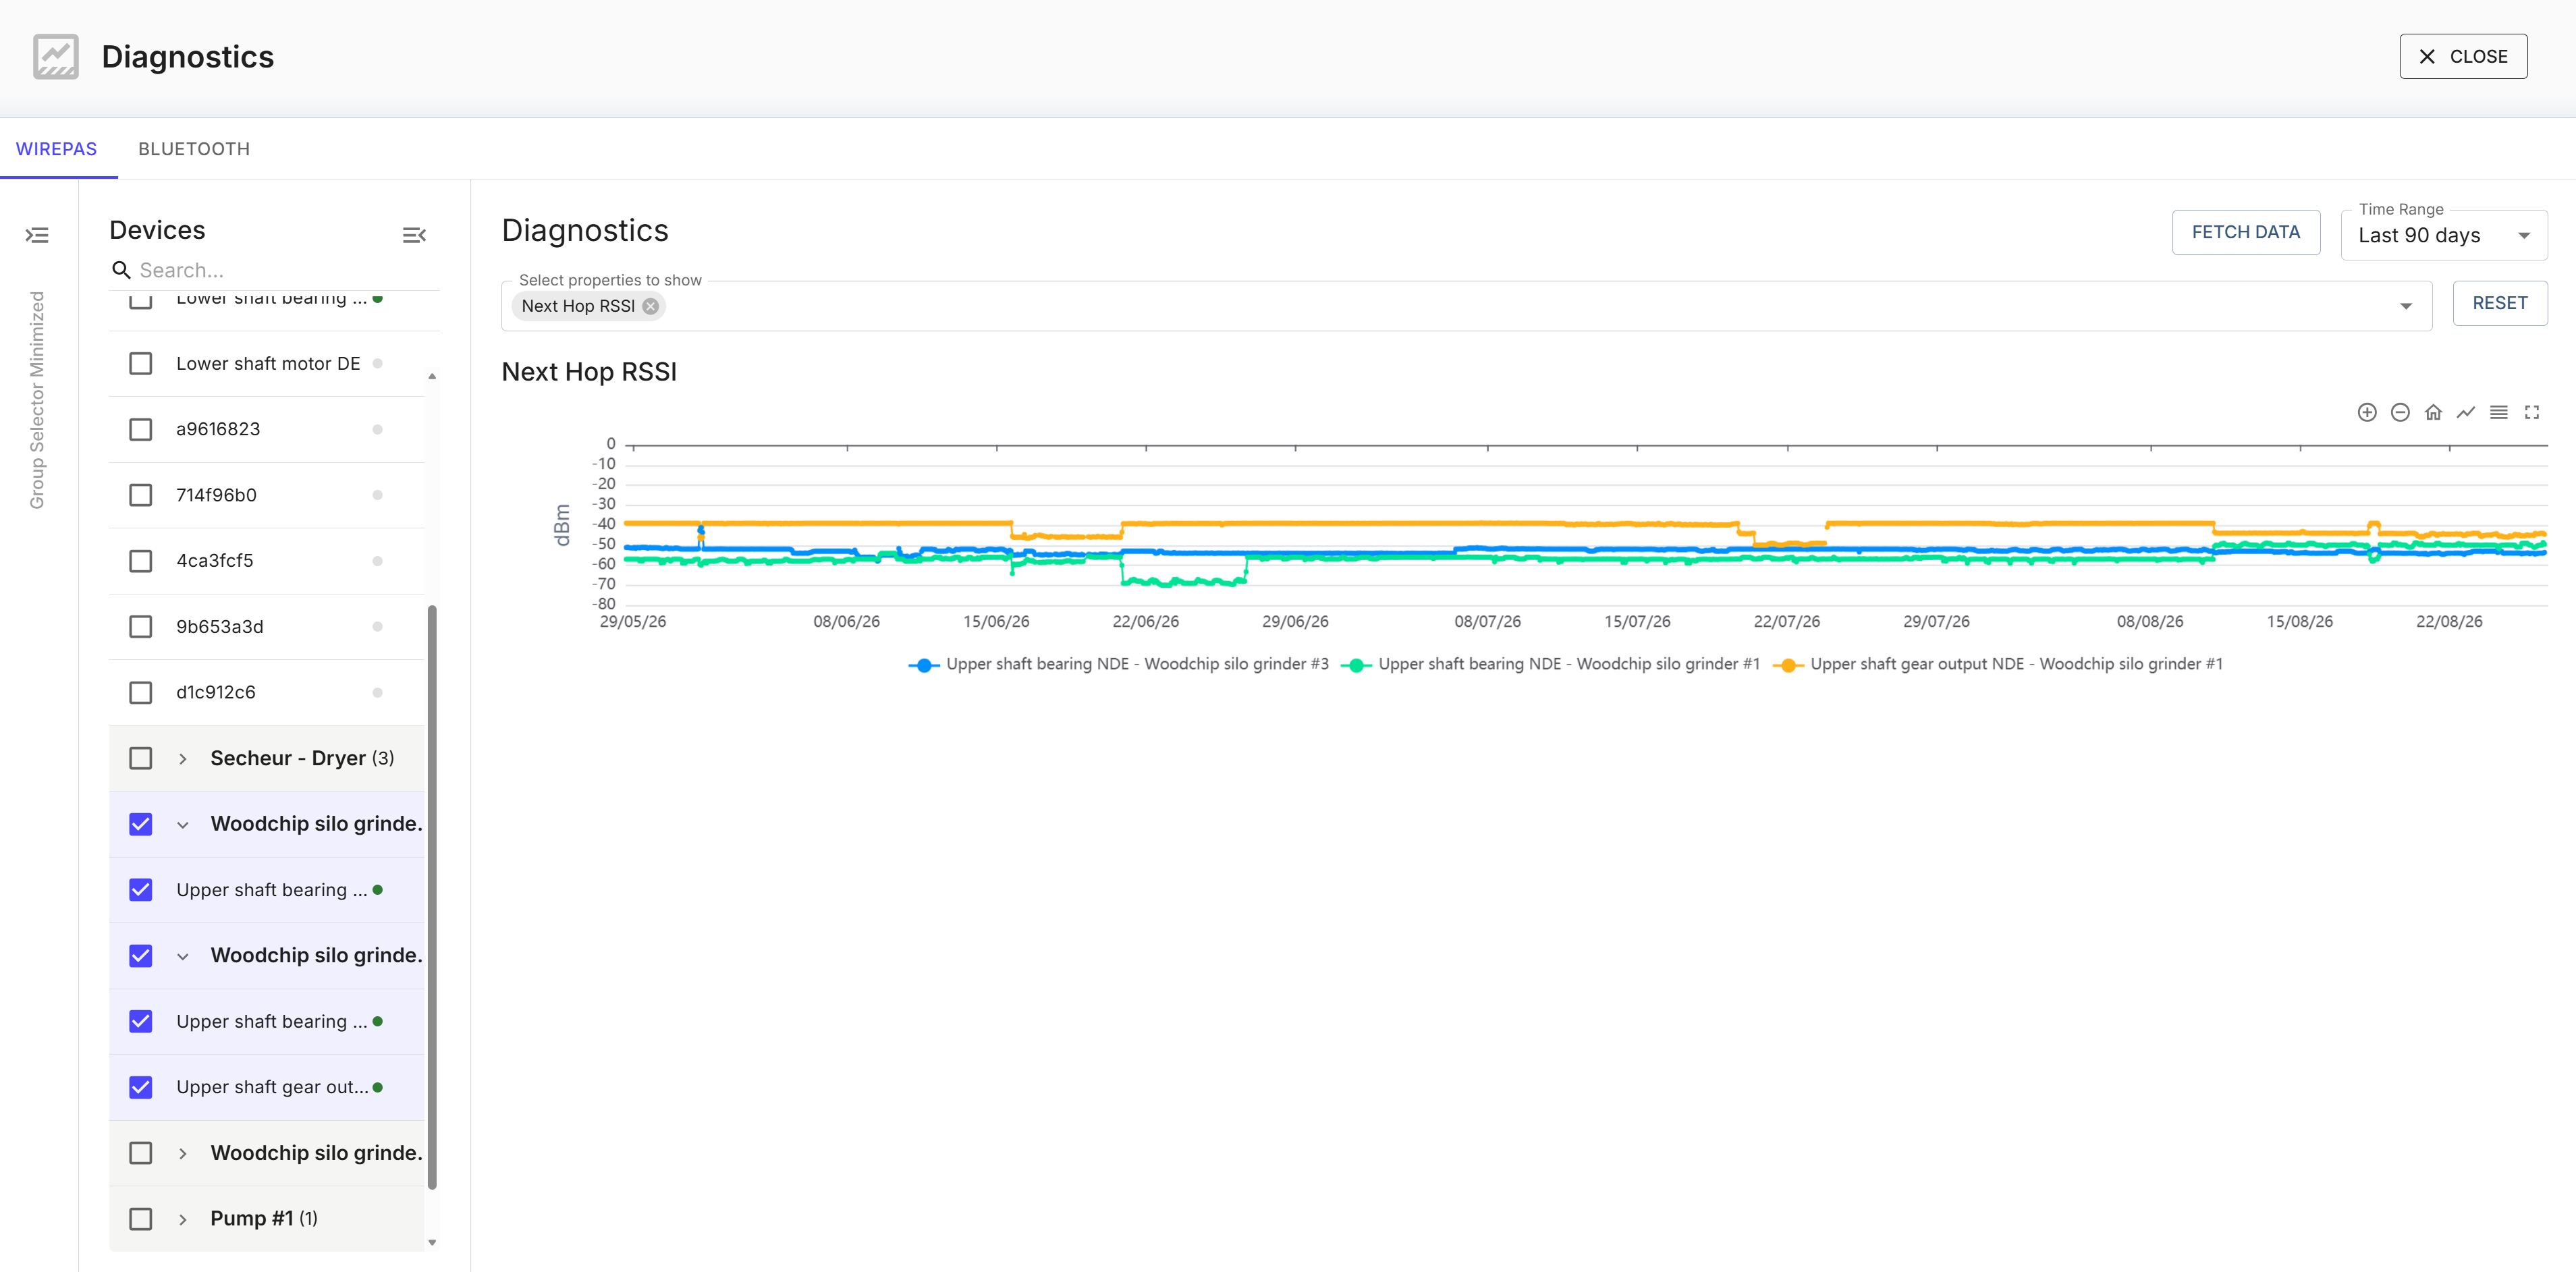
Find out why a sensor drops out, not just that it does. Diagnostics charts network-health metrics over time for Wirepas (Node X) and Bluetooth (Node C) devices.
- Wirepas — for Treon Industrial Node X and other mesh devices.
- Bluetooth — for Treon Industrial Node C.
Running a diagnostic
- Pick devices from the tree on the left (each shows Online / Offline).
- Select the properties to plot.
- Choose a time range — Last 3h / 6h / 12h / 24h / 7d / 30d, present day / week / month, or Custom.
- Fetch Data to draw a chart per property. Reset clears the selection; until you fetch, the panel shows No device selected / Click Fetch Data.
What the metrics mean
Wirepas:
| Metric | Meaning |
|---|---|
| Installation Quality Indicator | An overall %, summarising how good the node's placement/link is. |
| Next-hop quality | Link quality (%) to the node's parent in the mesh. |
| Next-hop RSSI | Signal strength (dBm) to the parent. |
| Next-hop power | Transmit power (dBm) used to reach the parent. |
| Buffer usage (average / max) | How full the node's buffers run (%) — high usage points to congestion. |
| Travel time | Latency (ms) for data to reach the gateway. |
Bluetooth (Treon Industrial Node C): RSSI (dBm).
A node that drops off intermittently usually shows it here first — falling RSSI or installation quality, or rising buffer usage or travel time. There is no single "hop count" number: the mesh routing is on the map (each edge is one hop to the parent), and these metrics describe the quality of that hop.