Condition Monitoring Events Analysis
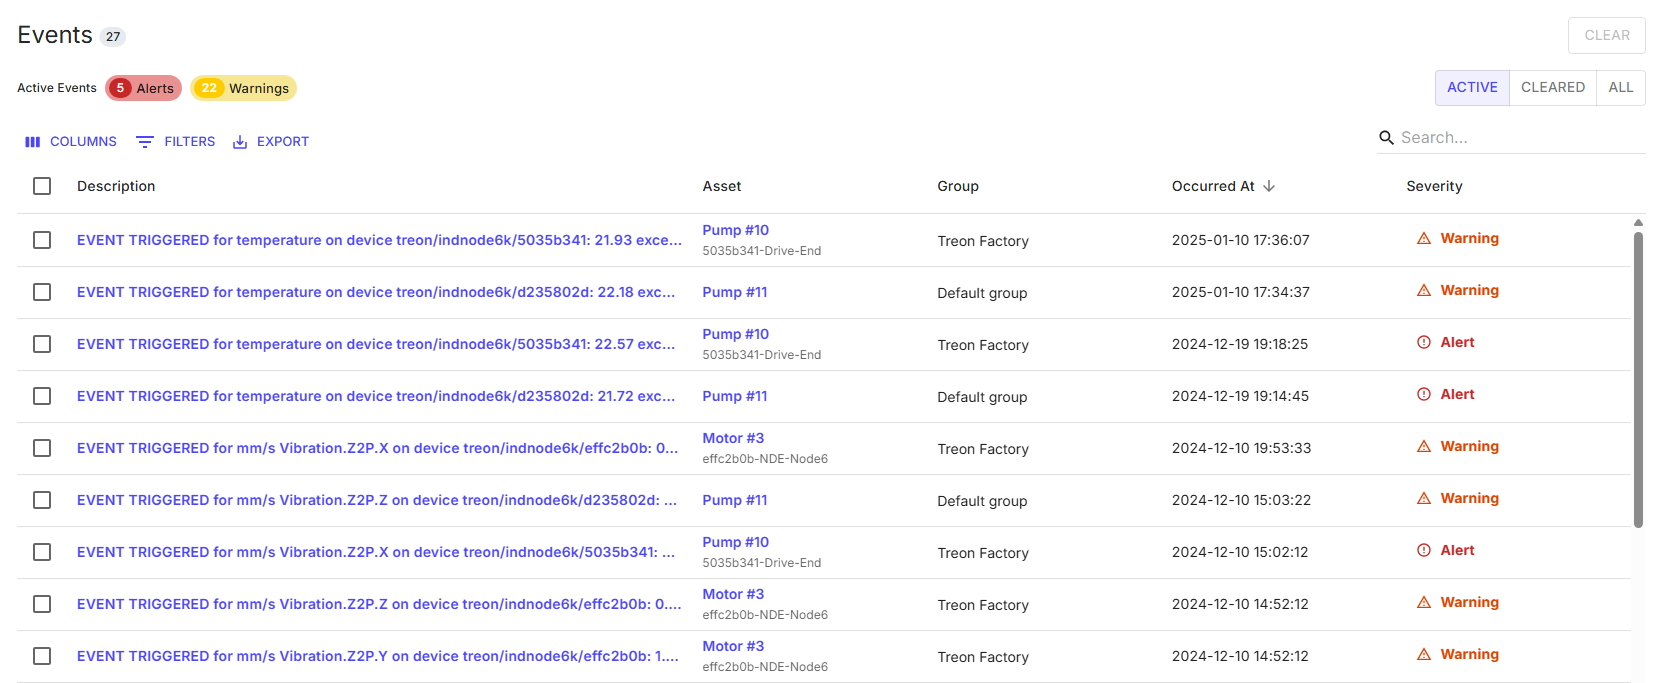
The Treon Connect Events app gives an overview of all warning and alerts. You can also see the events in the Condition app in the Trends (KPI) data timeline when the feature has been activated.
1. Events app
Choose the Events app from the Treon Connect main interface.

The fields on the top show all active events:
- number of alerts
- number of warnings

The main body shows the list of active alerts and warnings.
Each event has a full description which event was triggered and which Trends (KPI) event rule was violated.
It is listed for which Asset in which Group and at which time the event was triggered, as well as the severity (warning, alert).
If you click on the description of an event, a new window will open with the full information. This links directly to the Treon device and to the Asset measurement information, where you can check the current state of the measurement data.
You can as well choose to clear the event. After clearing the event, it will no longer show as active but as cleared.
In order to clear all events at once, choose Clear in the Events app to clear all events from the list.
Treon Connect will store the data when an event was cleared and by which user account.
Upcoming feature: Warnings and alerts can trigger messages sent out to key stakeholders.
2. Condition app
It is possible to show alerts and warnings in the Trends (KPI) data timeline in the Condition App Measurements tab.
You can turn on this visualisation feature by activating the Show events button in the Trends (KPI) menu for a specific asset sensor device.
Here is the traditional Trends (KPI) data visualisation:

And here the data visualisation with Show events turned on. The graph now includes the lines defined by the event rules and shows the data within these margins, or breaking these margins. Warnings are displayed as yellow lines, alerts as red lines:
